Hi everyone,
I don't know how to fix a line of annotation at the right of my graph. Maybe I didn't search very well 
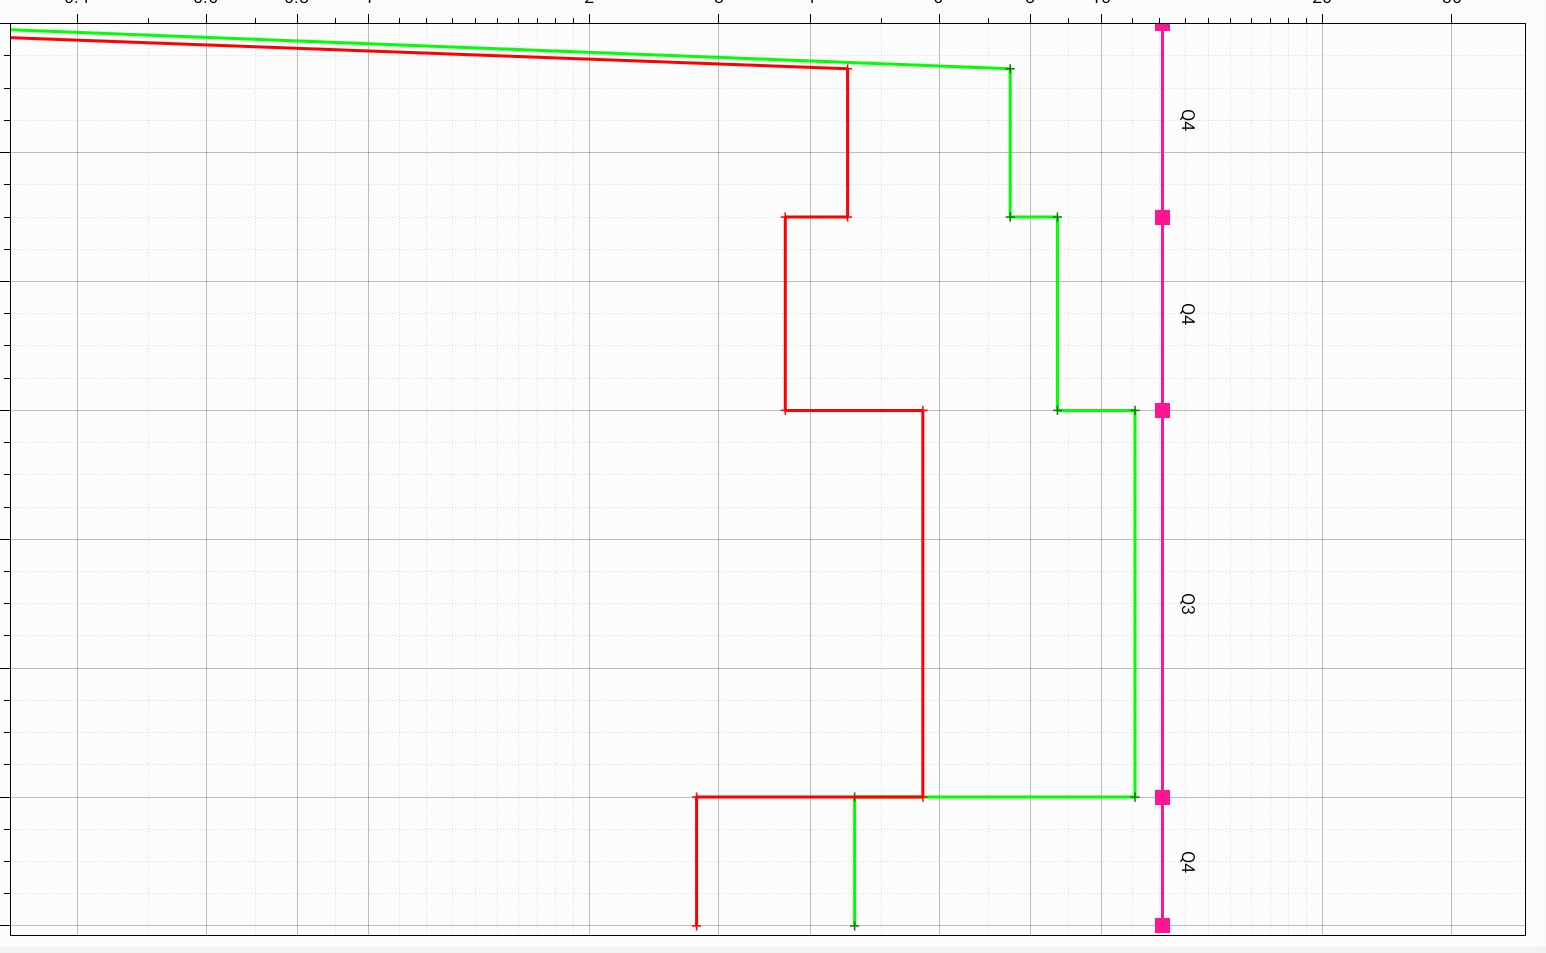
Now I have this :
I created some rectangleannotation to do that but I don't know how to fix these "lines" on the right of my graph.
This is my code :
`//Affichage du point de début
OxyPlot.Annotations.RectangleAnnotation rectStart = new OxyPlot.Annotations.RectangleAnnotation();
rectStart.MinimumY = l_fDepth_m[0];
rectStart.MaximumY = rectStart.MinimumY;
rectStart.MinimumX = fdist;
rectStart.MaximumX = rectStart.MinimumX;
rectStart.Stroke = OxyPlot.OxyColors.DeepPink;
rectStart.StrokeThickness = 10;
//Ajout d'annotation
this.Model.Annotations.Add(rectStart);
        for (int i = 0; i < nb; i++)
        {
            //Ligne pour une qualité
            OxyPlot.Annotations.RectangleAnnotation rectAn = new OxyPlot.Annotations.RectangleAnnotation();
            rectAn.Text = l_sztext[i];
            rectAn.TextRotation = 90;
            rectAn.Stroke = OxyPlot.OxyColors.DeepPink;
            rectAn.StrokeThickness = 2;
            rectAn.TextPosition = new OxyPlot.DataPoint( (fdist + 2), (l_fwidth_m[i]) / 2) + fdepth[i]);
            rectAn.MinimumY = l_fDepth_m[i];
            rectAn.MaximumY = l_fprof_max[i]);
            rectAn.MinimumX = fdist+ 1;
            rectAn.MaximumX = rectAn.MinimumX;
            //Ajout d'annotation
            this.Model.Annotations.Add(rectAn);

            //Affichage du point de fin
            OxyPlot.Annotations.RectangleAnnotation rectFin = new OxyPlot.Annotations.RectangleAnnotation();
            rectFin.MinimumY = l_fprof_max[i];
            rectFin.MaximumY = rectFin.MinimumY;
            rectFin.MinimumX = fQd_max + 1;
            rectFin.MaximumX = rectFin.MinimumX;
            rectFin.Stroke = OxyPlot.OxyColors.DeepPink;
            rectFin.StrokeThickness = 10;
            //Ajout d'annotation
            this.Model.Annotations.Add(rectFin);
        }`
I want this :

I don't know if I'm clear.
Thank you very much for you answer,
Marie